Industrial HVAC Energy Management: A DAT’Power Case Study
An industrial air-handling system manufacturer selected DAT’Power to structure and optimize its energy management strategy: multi-MES instrumentation, centralized hypervision, and role-specific dashboards. Discover how this project improves responsiveness and strengthens decision-making for energy and maintenance managers.
Focus on the context and needs of our client, an industrial HVAC manufacturer
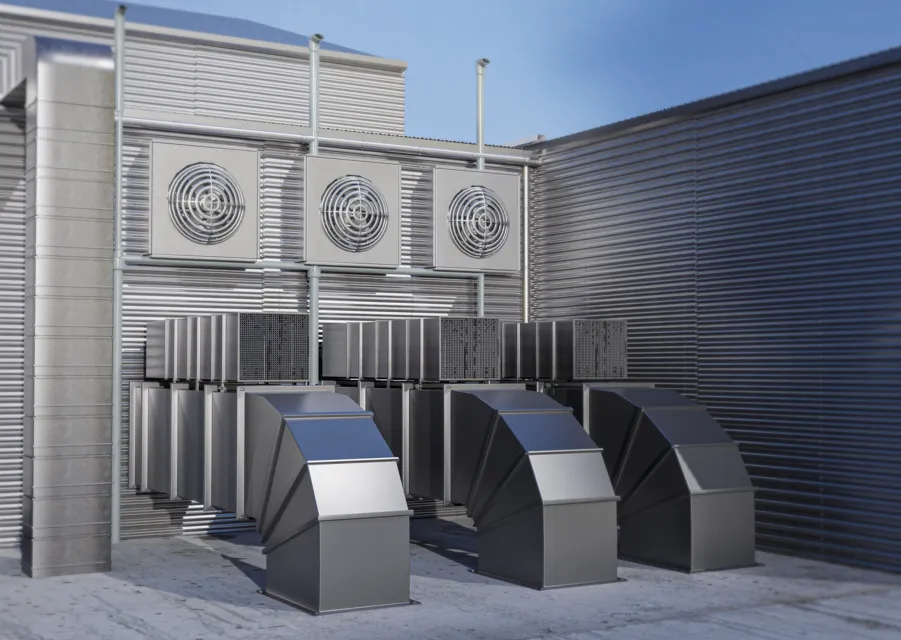
Our client, who will remain anonymous for confidentiality reasons, is an industrial manufacturer of air treatment, heating and cooling systems. Its production site, large and operating in multiple shifts, includes several Main Low Voltage Switchboards (TGBT), dispersed utilities and many Significant Energy Uses (SEUs) to monitor — from centralized compressed air to boilers and heat pumps, as well as numerous Air Handling Units (AHUs) and product testing zones.
The need expressed was clear:
- Manage energy at the site level and consolidate all consumption into a unified view.
- Detect drifts rapidly with reliable and understandable indicators.
- Adapt dashboards to various user profiles: management (costs & objectives), energy managers (SEU KPIs, drifts, €/day), maintenance teams (alerts, statuses, prioritization).
- Prepare the integration of energy data into the existing plant SCADA system and, eventually, into the ERP for enhanced global management.
The electrical networks are distributed across several buildings, compressed air is produced centrally, boilers and heat pumps ensure thermal comfort, while a large number of AHUs and test zones require consistent monitoring. These constraints required a unique and robust solution capable of centralizing all information.
If you also face specific constraints and centralizing your data is a major challenge, contact our experts and discover how DATIVE can support you in scoping and deploying a tailored Energy Management System.
Proposed solution: DAT’Power for hypervision and energy management at this ventilation equipment manufacturer
Technical site visit and metering plan definition
We began with a site visit conducted by our energy management experts. We mapped all SEUs and their subcircuits, then selected the high-value metering points:
- Electricity: sub-metering by workshops and by AHU, at minimum active power and active energy.
- Compressed air: production monitoring and electrical consumption of compressors to track kWh per Nm³ performance and baseload.
- Gas and heat: m³ gas pulses from existing boiler meters and thermal energy metering to correlate m³ gas with kWh heat produced.
- compressed air: kWh electricity per Nm³
- boiler: m³ gas per kWh heat
- other SEUs: kWh per production data where relevant
CEE funding study and budget validation
We assessed the project’s eligibility for CEE energy efficiency incentives (Certificats d’Économies d’Énergie), particularly the IND-UT-134 sheet when monitoring enables efficiency improvements. We always remind clients of the required principle of anteriority: the CEE addendum must be signed before any purchase order is issued.
Together with our CEE partners, we estimate potential incentives and quickly provide a binding commercial proposal including the funding.
Deliverable provided: a detailed CEE funding estimate report including assumptions, eligible perimeter, calculations, and next administrative steps to secure the budget.
Contact our team to obtain an accurate estimate of the CEE incentives applicable to your energy monitoring project and secure your budget.
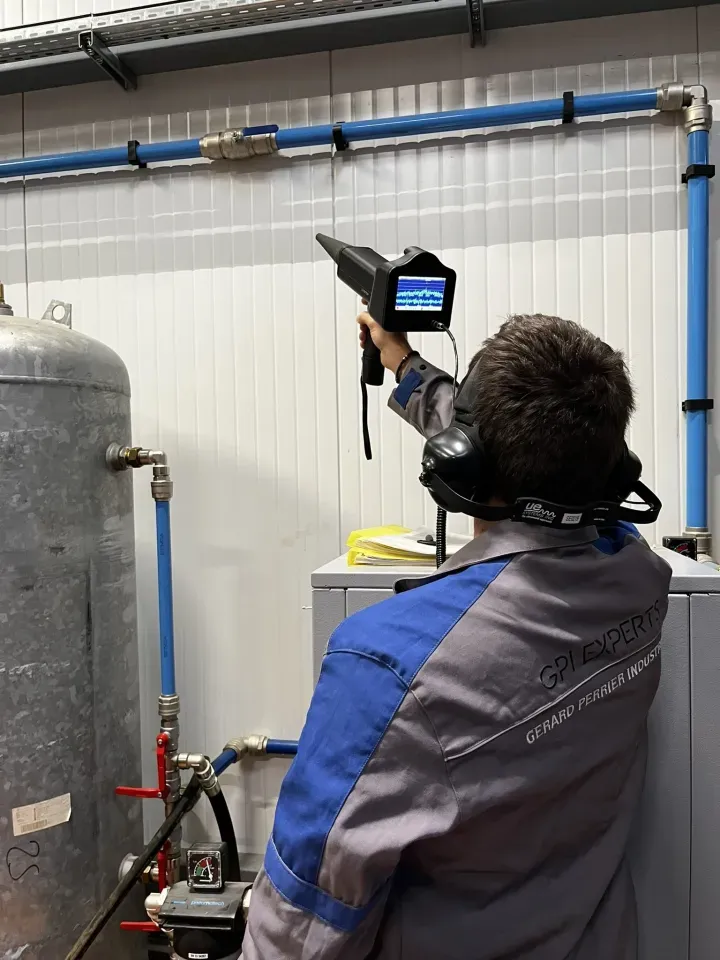
A trusted partner for installation works: SOTEB and the strength of the GPI Group
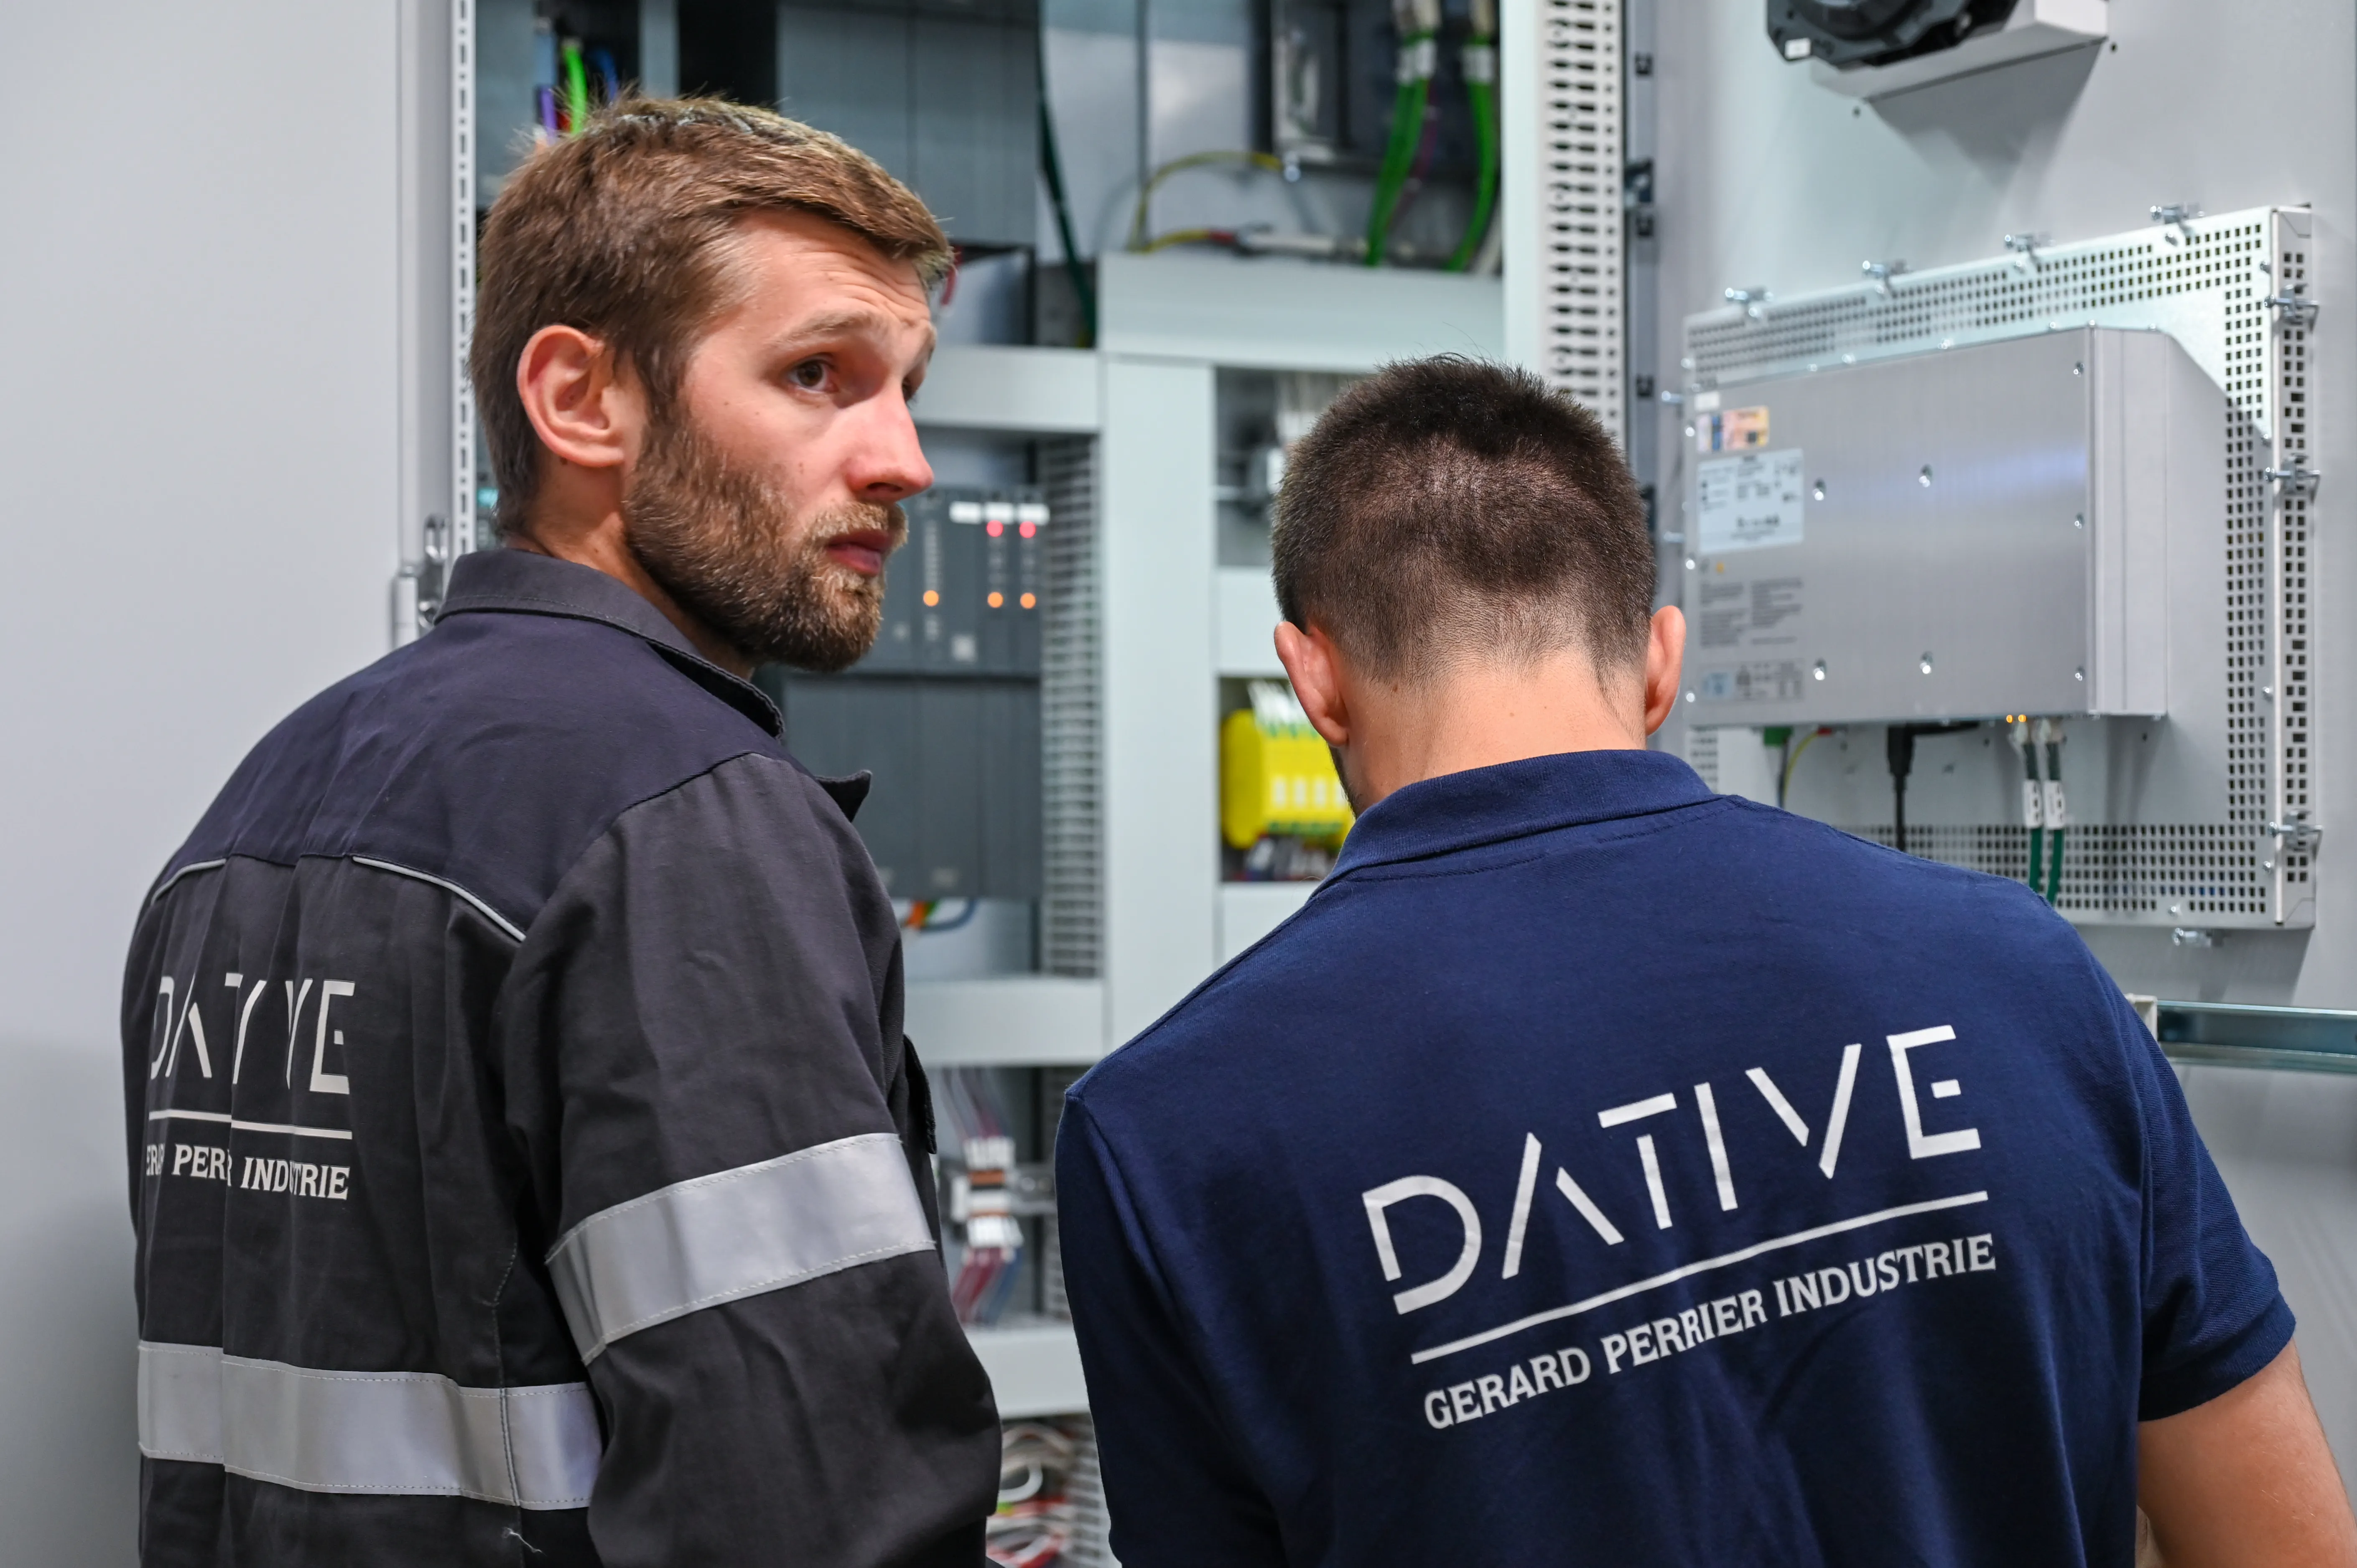
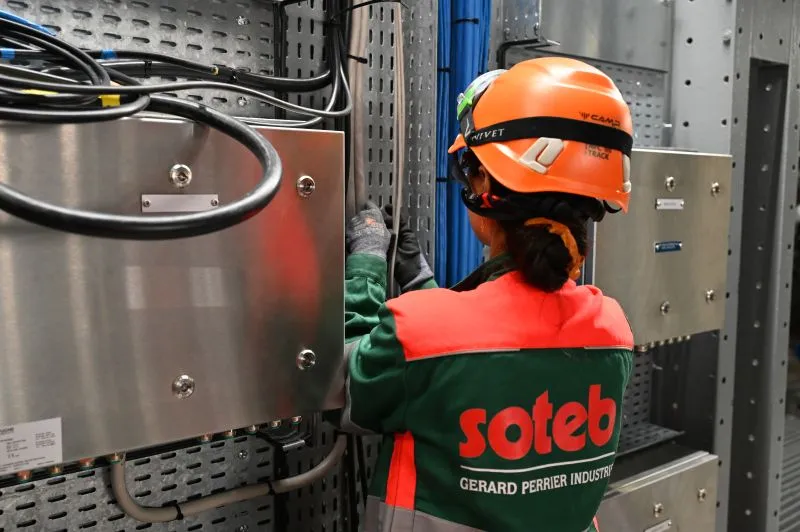
For instrumentation, electrical work and automation, we rely primarily on SOTEB, a subsidiary of the Gérard Perrier Industrie Group. Their teams operate in diverse environments — manufacturing, agro-industry, and sensitive facilities such as nuclear sites — and can deploy multi-site projects with consistent execution standards.
Deployment of the DAT’Power industrial energy management project
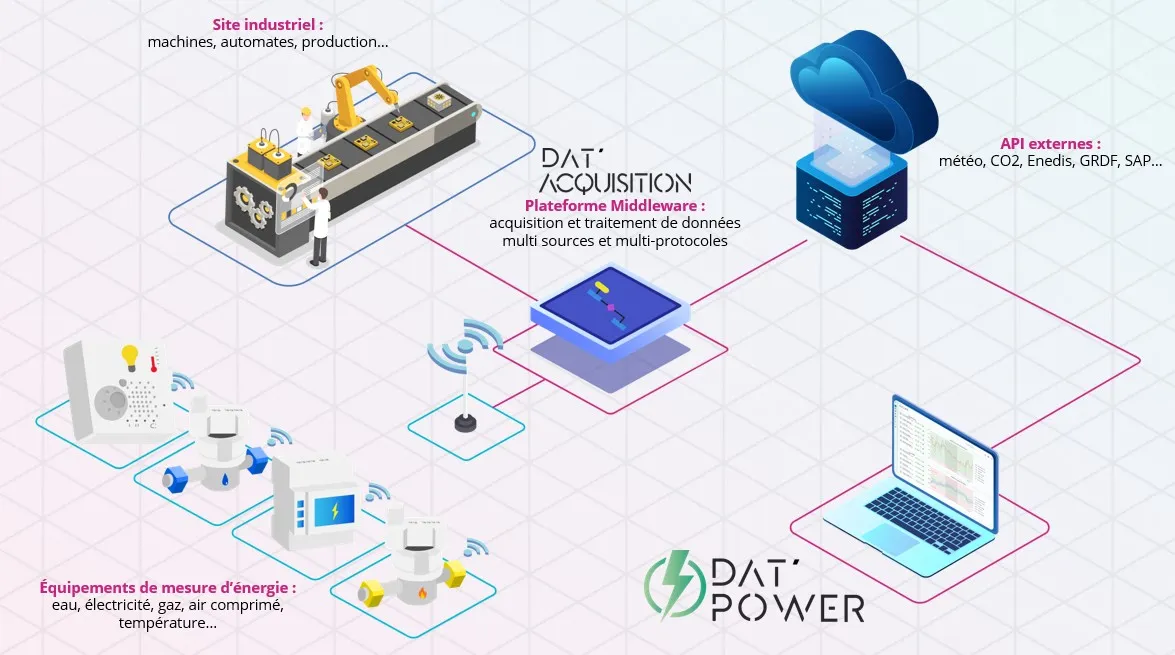
Instrumentation and data acquisition for utilities and energy consumption
- Compressed air: we measure production using a flow meter suited to pipe diameter and installation constraints, and monitor compressor electricity consumption. You track kWh per Nm³ and the baseload to quantify leaks. Key selection factors: straight-length availability, flow range, temperature, pressure, required accuracy, maintenance and calibration constraints.
- Electricity for SEUs, AHUs and heat pumps: we implement sub-metering per workshop, line or air handling unit. At minimum, we collect active power and active energy for stable indicators, including during transient phases. Depending on needs, we add voltage, current, power factor and harmonics analysis to refine drift diagnostics.
- Gas and heat: we integrate m³ gas pulses from existing boiler meters and add thermal energy meters on the hot water network. This links m³ gas to kWh heat and feeds SEU KPIs and efficiency ratios.
- IoT network: we deploy a private LoRaWAN to ensure reliable acquisition across a large site, hard-to-reach areas and strict cybersecurity constraints. This architecture has been proven in mountain environments, nuclear facilities and manufacturing industries, offering high resilience and local gateways ensuring service continuity.
To identify or validate the list of your SEUs and the relevant metering points for your site, contact our experts and schedule a Technical Site Visit.
Integration with plant SCADA and production data
We integrate the plant SCADA via a standard protocol such as Modbus TCP/IP, using a clear exchange table: addresses, units and frequencies. Production data is collected via files or regular data streams to compute SEU KPIs in kWh per production metric, such as treated m², units produced or runtime.
Examples:
- Mapping of the DAT’Acquisition server (data acquisition and centralization server) at plant level, SCADA client for local consultation.
- Automated CSV deposit in a secure folder, controlled ingestion, timestamping and quality checks, then computation of KPIs.
Custom configuration of industrial hypervision dashboards
We configure role-based dashboards in our DAT’Power solution so that each user has an actionable and relevant view.
- Management: objectives, consolidated costs, site trajectory.
- Energy management: SEU KPIs, drifts, euros per day, action priorities, plan monitoring.
- Maintenance teams: alerts, statuses, prioritized intervention list, baseload anomalies.
Commissioning and user training
We perform a functional commissioning for each SEU, verifying measurements, calculations and alerts. We train site managers, energy managers and maintenance teams, and review alert workflows, drift analysis, baseload monitoring and escalation rules.
Example rule: If the baseload exceeds X kWh for Y hours on the compressed air SEU, notify maintenance, open a task and track the fix in the action log.
Metrics monitored: coverage rate of metering points for critical SEUs, alert SLA defined according to process impact, and action closure rate within target timelines.
Results and expected benefits for this air-handling equipment manufacturer
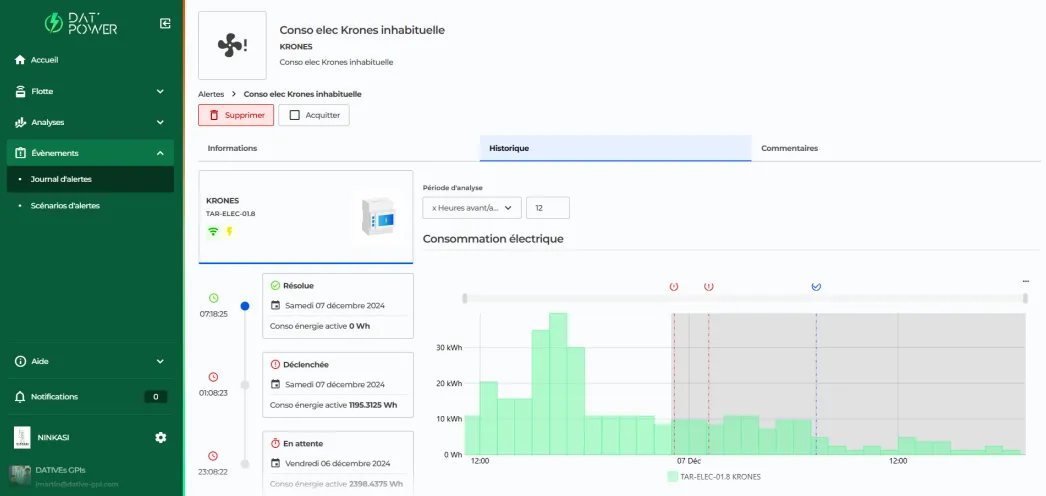
Thanks to DAT’Power, the site now has SEU-level visibility (AHUs, heat pumps, compressed air, boilers) and consistent indicators to manage consumption.
- Reduction of consumption per SEU: Direct reading of KPIs and drifts enables rapid correction of deviations and stabilizes consumption.
- Increased reactivity: Dynamic alerts allow reactions within the same day instead of end-of-month analysis, reducing energy costs and preventing process incidents.
- Process stability: AHUs and heat pumps experience fewer fluctuations thanks to continuous monitoring, and test zones maintain consistent conditions.
- Traceability: Consolidated data supports energy-saving plans, internal audits, and forms a prerequisite for CEE incentives when eligible actions are implemented (IND-UT-134 sheet, to be verified per scope).
Concrete example: In the utilities workshop, an abnormal compressed-air baseload was detected by DAT’Power. After corrective action, the baseload dropped by more than 15%, immediately improving overall compressor efficiency.
Metrics monitored:
- SEU KPIs (kWh per produced unit or Nm³)
- Euros per day saved after actions
- Leak rate reduced below target thresholds
You can contact our energy experts to obtain an estimation of your potential savings and ROI through an initial assessment of your perimeter.
Next steps and future evolution for our client
Remote control of lighting: DAT’Power GTB/GTC features
DAT’Power goes beyond energy monitoring. With its LoRaWAN dry contacts, it enables the remote control of simple loads such as lighting. Scenarios can be based on schedules, presence detection or occupancy conditions.
The HVAC site is already preparing to integrate this feature, making DAT’Power a fully scalable BMS/GTB platform, not just an energy monitoring tool.
We published a dedicated article for industrial sites subject to the BACS Decree and which can achieve compliance thanks to DAT’Power.
Moving toward predictive maintenance with DAT’Process
Beyond periodic or preventive maintenance, predictive maintenance aims to detect weak signals announcing failures or drifts. With our industrial monitoring solution DAT’Process, you correlate load/no-load cycles, temperatures and vibrational analysis to anticipate issues on compressors, AHUs and heat pumps.
Use case: a vibration drift on a compressor, combined with increased no-load operation, enabled a belt replacement to be planned before failure, avoiding a production stoppage and excess energy consumption.
Contact us to discover DAT’Process and integrate predictive maintenance into your energy and maintenance strategy.
Conclusion
With DAT’Power, our client — an HVAC equipment manufacturer — now monitors its consumption per SEU, visualizes drifts in real time and reacts more quickly to alerts. The result: quantified savings, greater stability on AHUs, heat pumps and test zones, and full traceability for audits and energy-saving plans.
The next step is to expand the metering perimeter, remotely control certain equipment (such as lighting) via LoRaWAN dry contacts, then evolve to the DAT’Process platform to anticipate mechanical and thermal drifts. The company is building long-term energy management capabilities, valuable for management, energy teams and maintenance alike.
To benefit from our experience and deploy your own Energy Management System, contact our energy experts and take the first step toward tangible savings and actionable improvements.
News
In the industry, it is impossible to optimize what is not measured. In the face of the sustained increase in energy costs, regulatory requirements, and industrial performance objectives, all industrial companies are now concerned with controlling their consumption, whether it is a financial, environmental, or strategic issue.

Looking to control your energy consumption and costs while meeting regulatory requirements (CEE, ISO 50001, BACS Decree)? By combining Carlo Gavazzi sensors and meters, the Dupline fieldbus and the DAT’Power Energy Management System, you can turn your site data into clear dashboards, relevant alerts and actionable decisions, delivering a tangible return on investment.

On December 2nd, our DATIVE teams will participate in the Energy for Industry trade show at the Lyon Convention Center. This event, which has become a must-attend for players in the industrial sector, brings together each year experts, suppliers and decision-makers committed to the energy transition
Anonymized 2025 case study: how we deployed DAT’Power on an upper-tier SEVESO site, in controlled phases, to balance HSE, cybersecurity, production continuity and measurable savings.