Compressed-Air Leaks in Industry: DATIVE and Les Experts GPI Help You Cut Your Energy Bill
Compressed-air leaks weigh heavily on your costs and performance. Discover how DAT’Power detects and alerts in real time, monetizes losses in €/day, and helps you prioritize field interventions with Les Experts GPI—up to predictive maintenance with DAT’Process.
Introduction
Compressed-air leaks are expensive and undermine your industrial processes. With DAT’Power, you detect and alert in real time, quantify losses in €/day, and prioritize interventions. Les Experts GPI fix issues in the field, while DAT’Process takes you to predictive maintenance for durable gains.
Why hunt down compressed-air leaks in industry?
Compressed-air leaks directly drive up your operating costs and destabilize the network:
- Pressure drops
- Quality drifts on sensitive processes
- Accelerated equipment wear
They also mask other, subtler anomalies. In the end, site-wide performance is impacted.
Useful orders of magnitude: significant financial losses tied to industrial gas and compressed-air leaks
On poorly controlled networks, losses frequently range from 20–30%. With a structured approach, a realistic target is ≤ 10–15%. The gap often pays for a large share of corrective actions on its own: depending on plant size and electricity price, we are quickly talking thousands of euros per month.
Operational effects: a process that slows down and overconsumes
Unstable pressure penalizes downstream machines: longer cycle times, scrap on critical lines, disturbed restarts. Compressors compensate by running longer to maintain the base load during stops. Result: overconsumption, overheating, unplanned maintenance, and lower availability.
What we actually track
- The network’s overall leak rate
- Night, weekend, and idle baselines
- Real-time leak alerts when drifts occur
This trio provides a clear view of electrical overcosts and process risks, and a common basis to prioritize actions.
Field example: at a multilayer cardboard production site, the night baseline doubled after a maintenance shutdown, with ±0.4 bar pressure variation at restarts. Our leak-hunting campaign brought the leak rate below 15%, delivering immediate energy savings and restoring process stability.
Measuring quickly, alerting early, and costing in €/day lets you triage urgencies, then launch a targeted campaign with Les Experts GPI—our specialists in detecting and locating leaks on compressed-air networks, part of Groupe Gérard Perrier Industrie, of which DATIVE is a subsidiary. Everything is tracked and measured in DAT’Power.
Talk to an expert — schedule a first on-site assessment focused on leak rate and baseline
The industrial sectors most exposed to compressed-air / gas / steam leaks
Pulp & Paper (paper mills, corrugators)
Very extensive networks, continuous operation, numerous pneumatic stations and dryers: even minor leaks degrade pressure and disrupt line speeds. The cost/quality impact is immediate, hence the value of fine baseline tracking and real-time alerts to avoid restart drifts.
Food & Beverage
Stringent hygiene and cadence requirements, many valves and fittings exposed to washdowns/NEP/CIP: micro-leaks accumulate and force compressors to overwork to hold the set pressure. Regular checks on critical loops and compressor hours secure availability.
Automotive & Metalworking
Pneumatic tools, robots, assembly/handling stations: in dense networks, a few leak points can trigger local pressure drops and process variability (clamping quality, throughput). Monitoring leak rates by shop helps target corrective campaigns with the best ROI.

Plastics processing
Pressures and flows vary by phase (blow molding, injection, auxiliaries): leaks increase compressor idle cycles and heat up the network. Monitoring night/weekend baselines and load/idle profiles quickly surfaces structural losses.
Pharma & Cosmetics
High sensitivity to quality and traceability: unstable pressure can impact sterile packaging or critical operations. Threshold alerts and quantified gains (€/day) make decision-making and audits easier (ISO 50001, sobriety plans).
See also: our reference article on compressed air—ideal to frame orders of magnitude and prepare your actions.
Move from observation to action. To quickly identify savings potential and prioritize interventions, we offer an express diagnostic by Les Experts Gérard Perrier Industrie: instrumented survey (ultrasound), qualification of leak points, and quantified loss estimates over a sample perimeter. You can then decide on a full campaign and track results in DAT’Power.
Request an express diagnostic of your compressed-air system via our contact form.
Stop suffering from compressed-air leaks with our DAT’Power monitoring and automatic alerts
Calculate and track your compressor efficiency
The right KPI to monitor a compressor is efficiency in kWh per m³ of air produced. In DAT’Power, you track this IPE over time, compare load and idle periods, spot drifts after restarts, and target likely causes—leaks, pressure setpoint too high, dryer faults.
On CEE (French Energy Savings Certificates), instruments exist for compressed air, but amounts are often limited on the compressor alone—the main value remains continuous energy savings through monitoring.
Track your industrial air baselines and detect anomalies
The baseline is residual consumption when production is stopped, typically at night or on weekends. It’s the first lever because it concentrates losses from leaks and equipment left open. Our Energy Management System DAT’Power displays baselines by shop and time slice, and highlights gaps—for example, a weekend baseline rising after an intervention. Start here to cut consumption quickly, then refine on production windows.
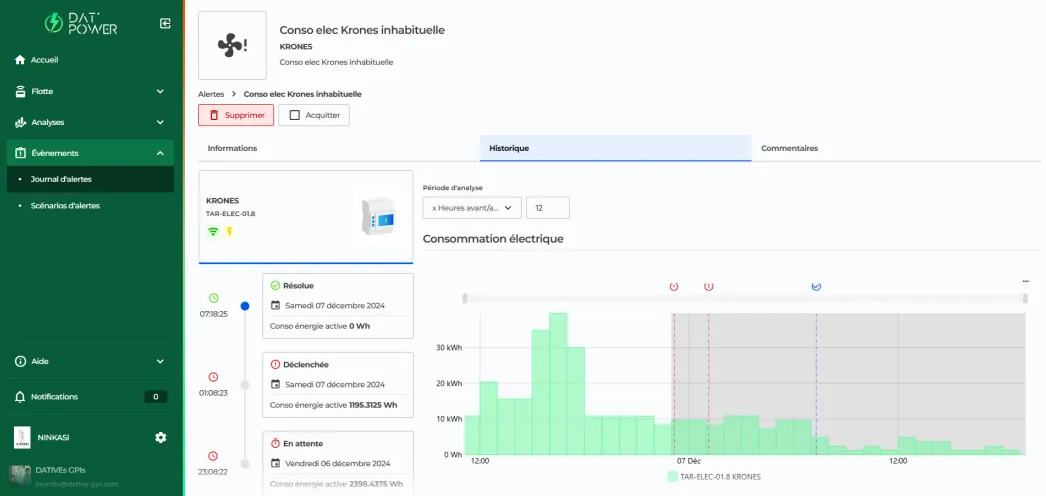
Set personalized thresholds and real-time alerts
Define fixed or dynamic thresholds based on operating hours. Alerts are sent on multiple channels (email or mobile notifications) and assigned to the right user profiles (maintenance manager, line owner, energy manager, etc.).
Simple rule example: if the baseline exceeds X kWh for Y hours, notify team Z. If needed, DATIVE energy experts help you exploit the data—threshold choices, trend reading, action plans.
Measure and monetize losses from leaks on your compressed-air network
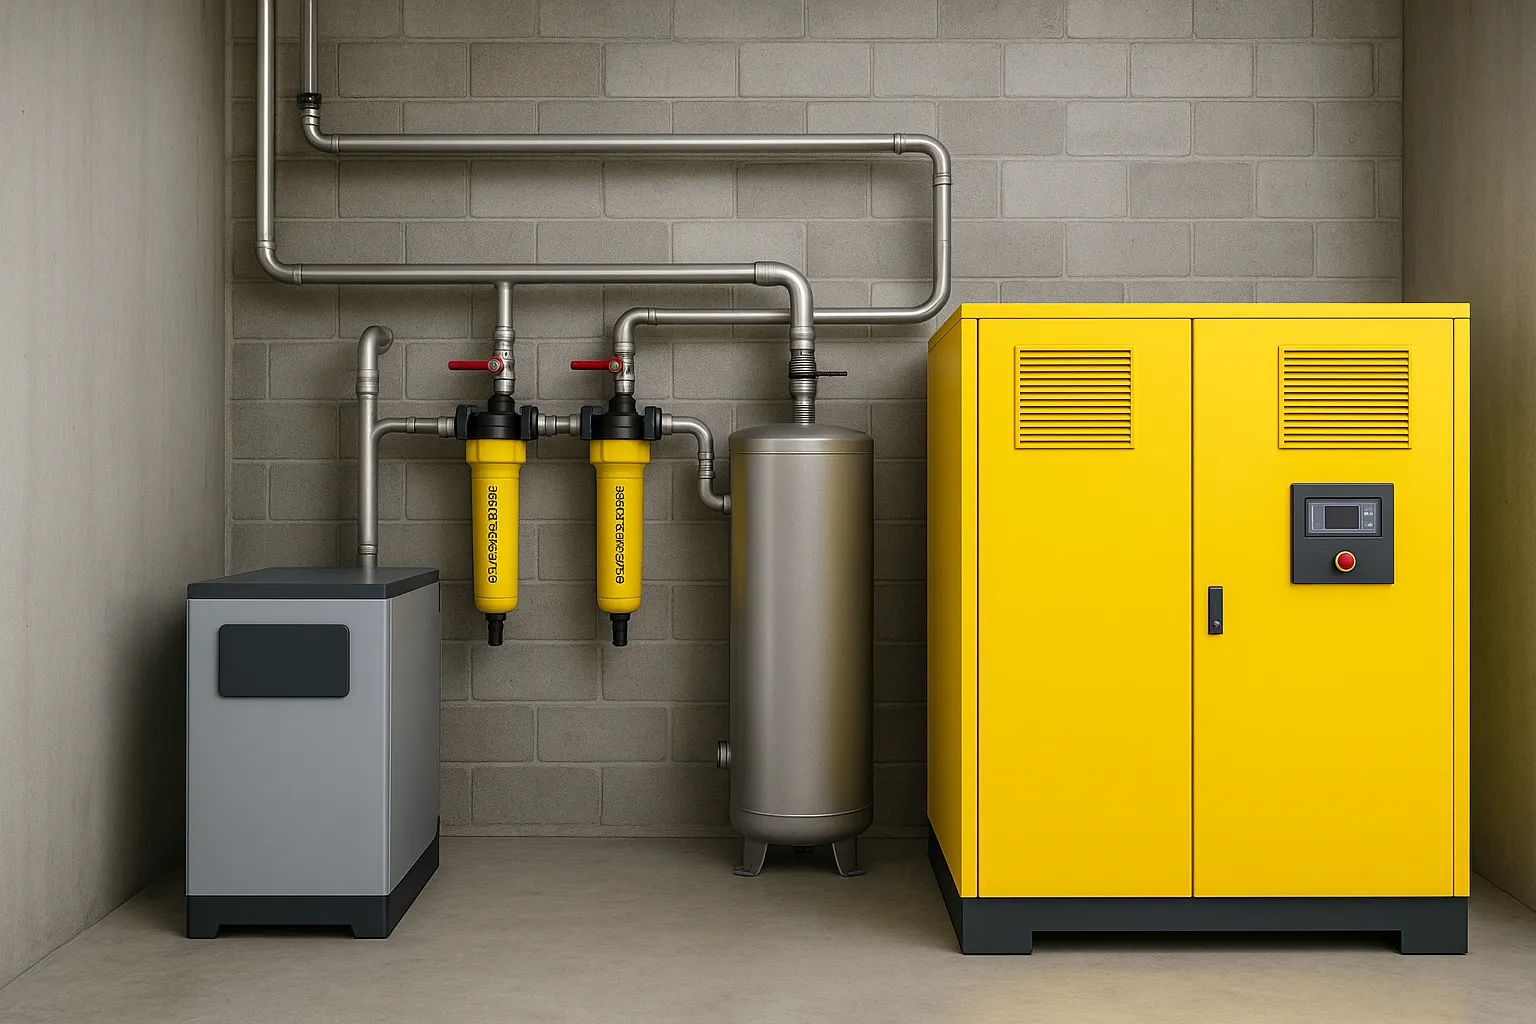
Instrumentation and continuous measurement
We size the additional instrumentation suited to your network: energy meters on compressors, flowmeters on main branches, pressure and temperature sensors to qualify load profiles, and shop/machine-level meters when relevant. Dual objective: measure production and use continuously, then isolate drifts via idle baselines. Best practices: standardize unit references, secure timestamps, document operating changes so period-to-period comparisons are apples-to-apples.
Contact us to estimate the cost of instrumentation and monitoring for your perimeter.
kWh → €/day conversion to monetize your gains
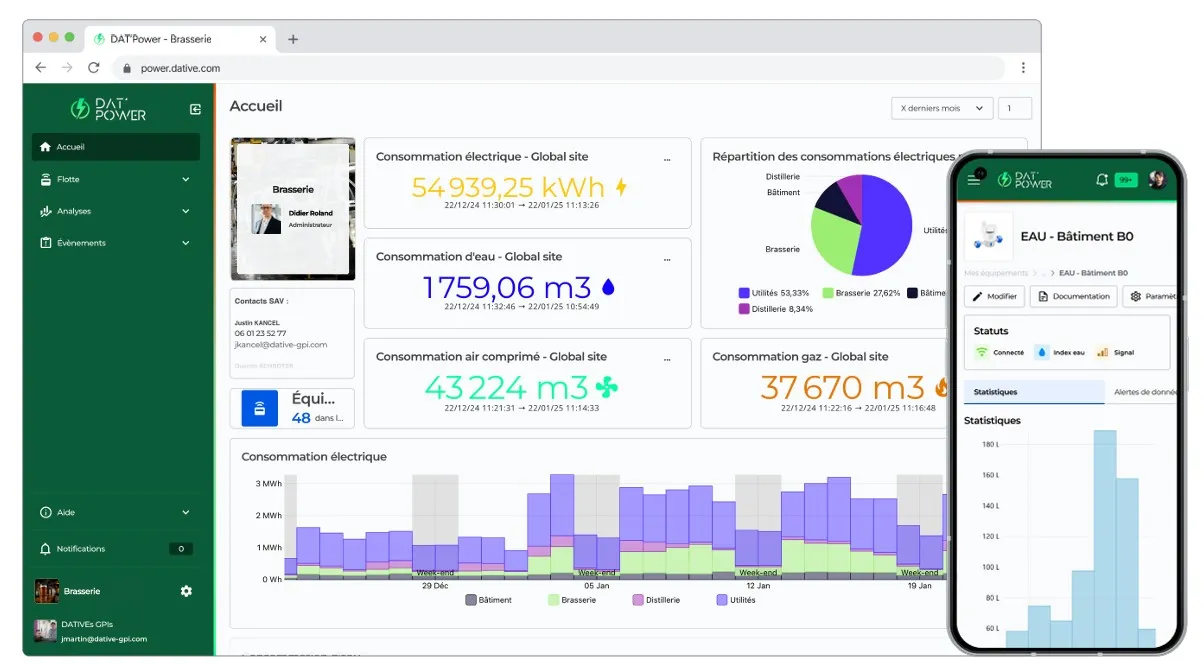
In DAT’Power, we configure your electricity tariff. Energy curves are automatically converted to euros per day and per month, with annual projection. You can then tie a drift to an overcost everyone understands (operations, maintenance, management).
Example: a 12 kWh/h baseline equals €28.8/day at €0.10/kWh, i.e., €864/month on a 30-day basis. This economic view eases intervention decisions and prioritization.
Talk to a DATIVE expert to scope minimal instrumentation, baseline tracking, and € conversion setup in DAT’Power.
Prioritize your leak-reduction campaigns (maintenance or repair)
ROI vs. losses, potential gains, and campaign cost
In DAT’Power, campaign triggering relies on a simple trio—leak rate, baseline, and configured energy cost. The tool converts drifts into €/day, €/month, and annual projection, then compares this potential with the estimated cost of a leak-reduction and remediation campaign. The ROI is clear—you prioritize shops where the balance is favorable.
Go/No-Go example: if Shop A’s baseline costs €35/day and the campaign is estimated at €2,500, the ~3-month payback threshold is quickly crossed → Go. If Shop B weighs only €8/day for a €3,000 cost, you schedule later or bundle actions to improve ROI.
Verify the impact of your leak-repair campaign with DAT’Power
Before intervention, freeze a reference period, including nights and weekends. After intervention, compare periods in DAT’Power: track the baseline drop, compressor efficiency (kWh per m³), compressor hours, and pressure stability. Gains are visible live in dashboards and consolidated as €/day avoided, helping you secure next decisions.
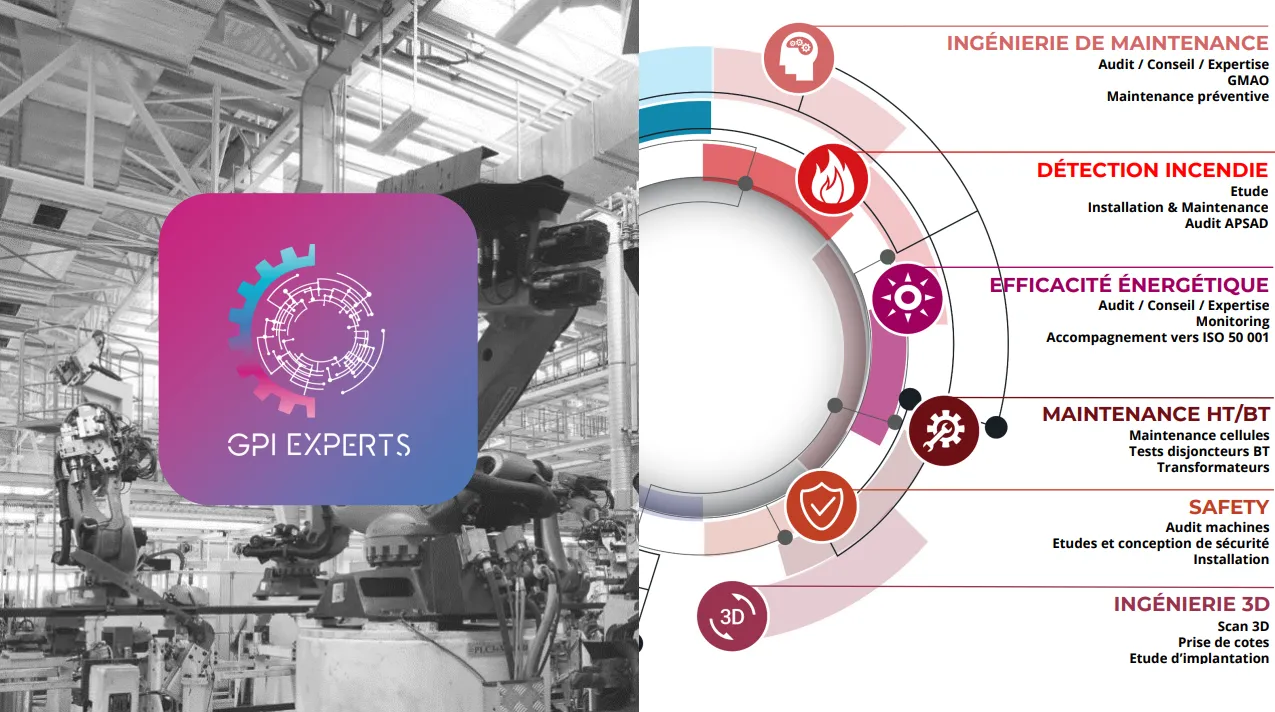
Take action with Les Experts GPI for compressed-air and industrial gas leak detection
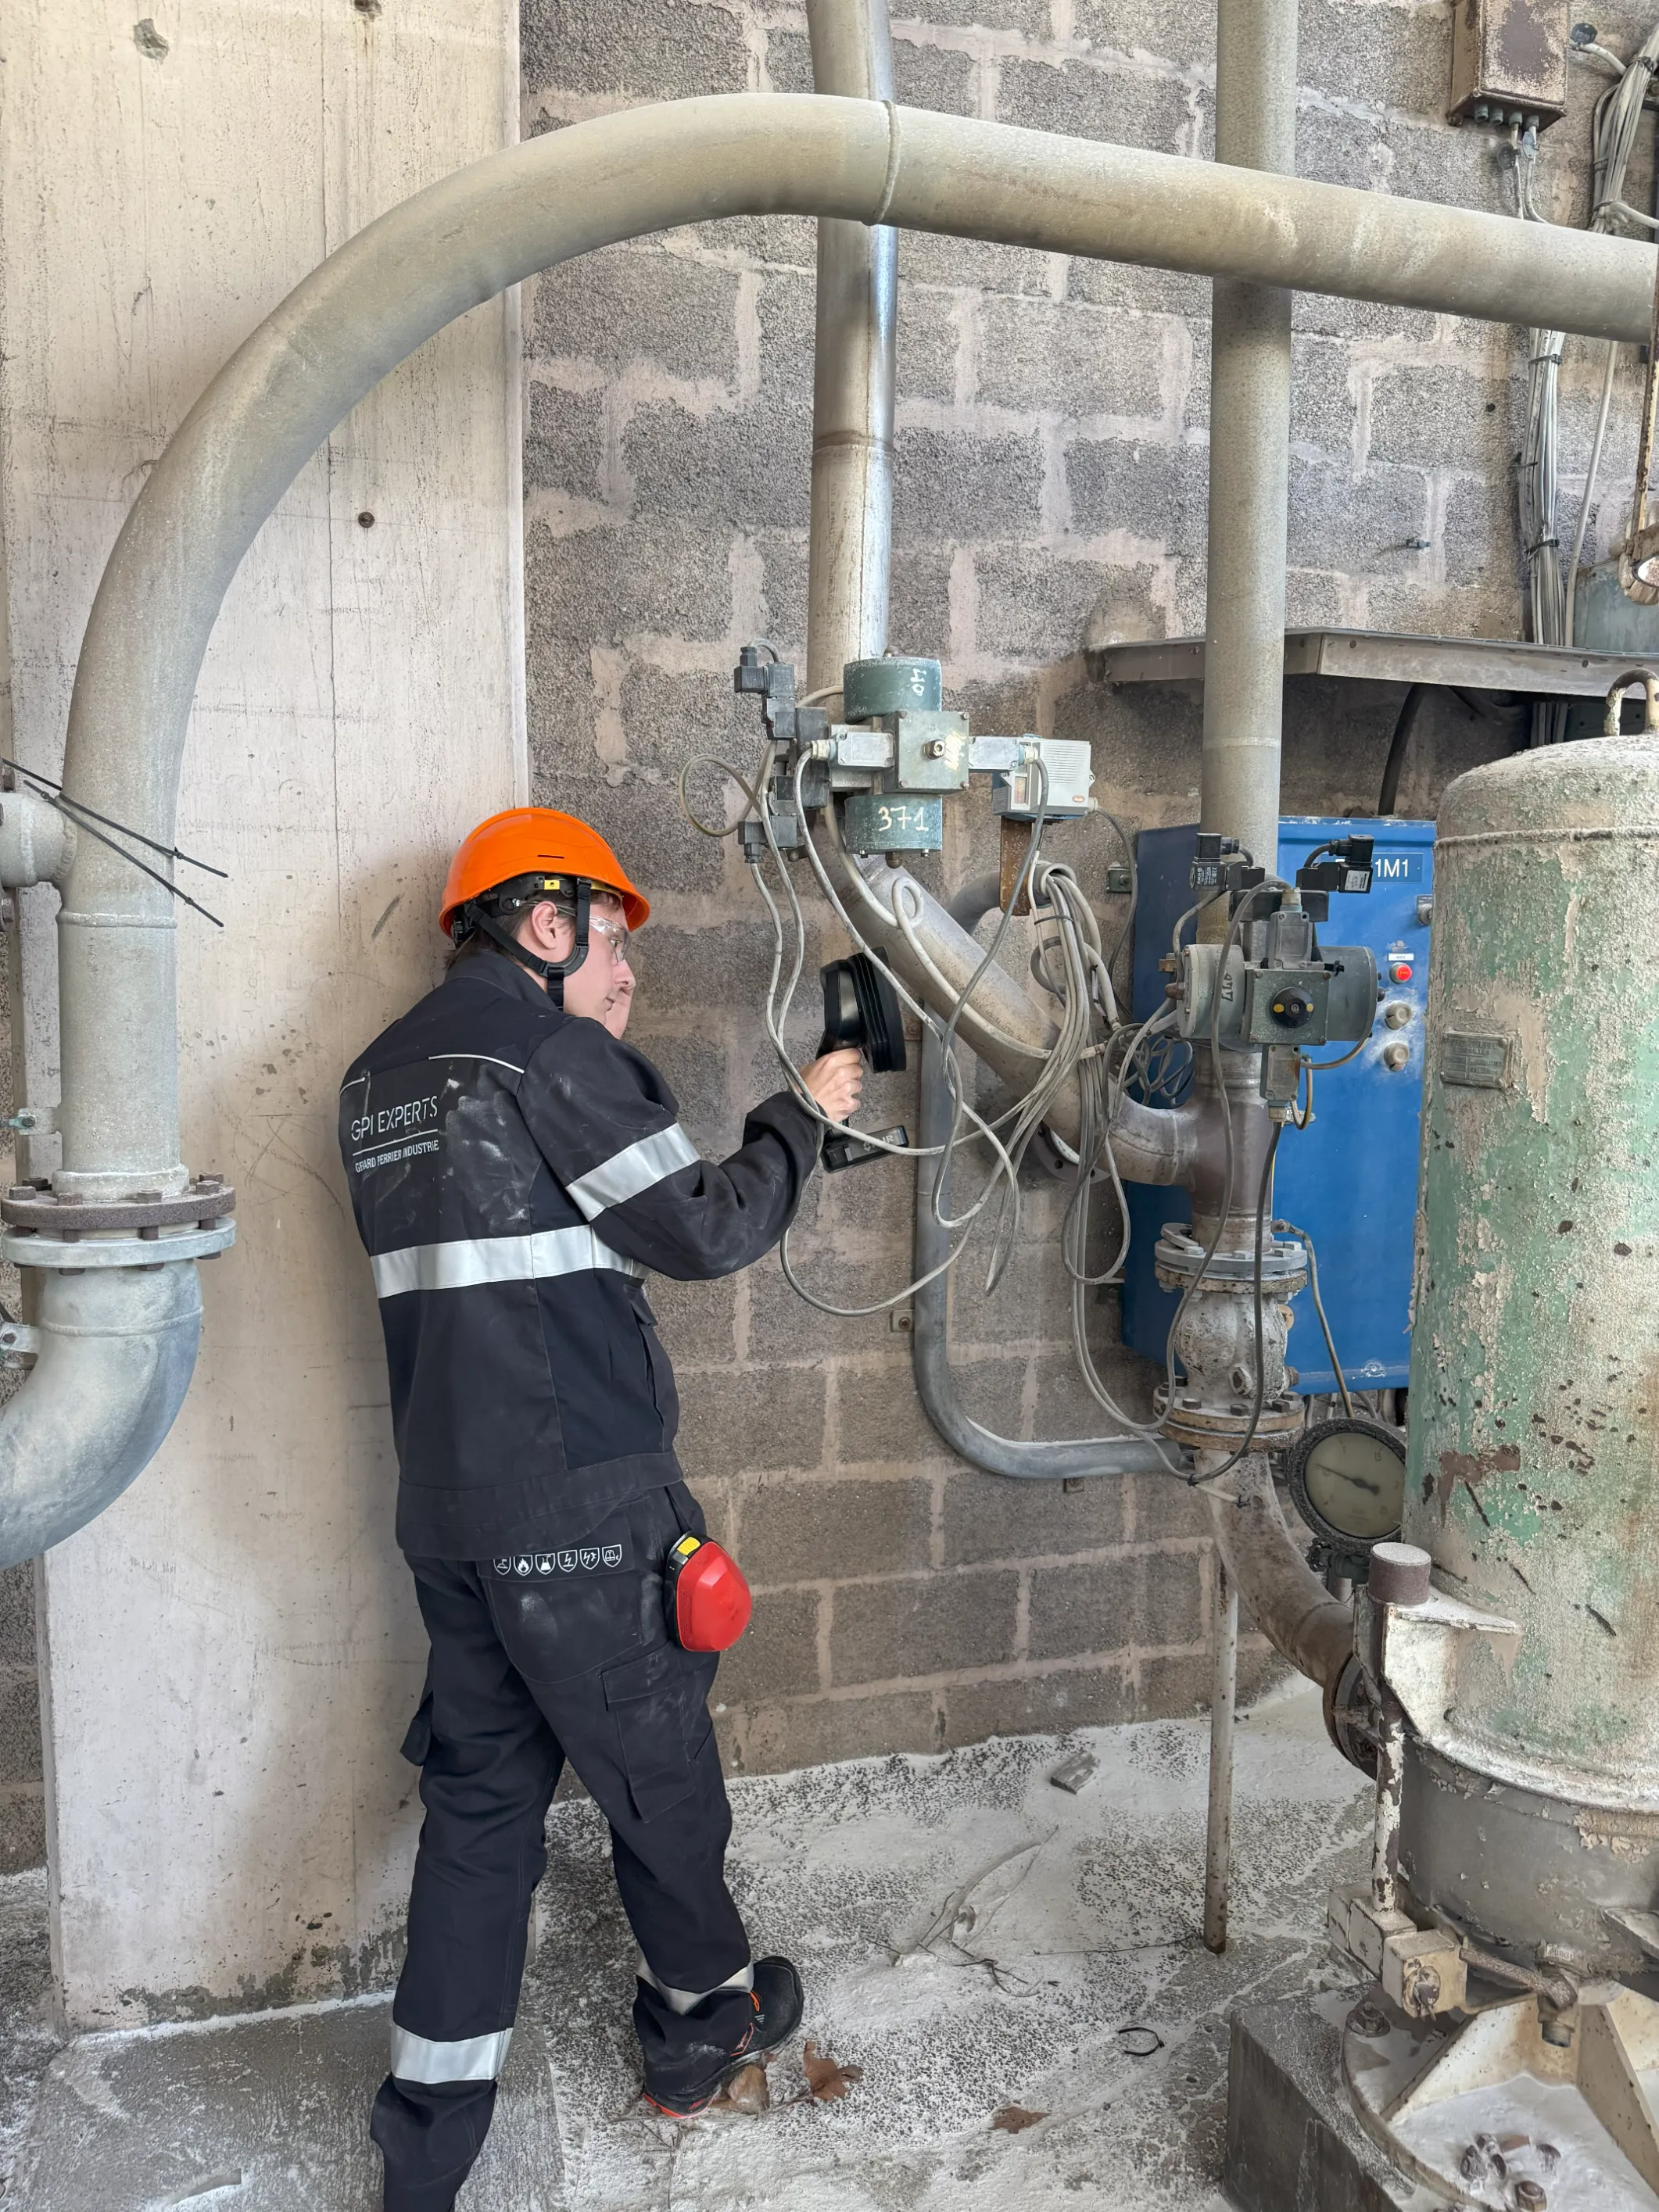
Instrumented survey with FLIR Si2 Pro ultrasonic camera
Les Experts GPI work on your industrial sites with an ultrasonic camera, walk the lines and networks, perform targeted listening, and precisely locate each leak. Every leak point is photographed, geo-located within the shop, and qualified—estimated in volume and approximate kWh. You receive a clear intervention sheet that feeds your action plan and repair priorities.
Concrete on-site example: in a prep area at a pulp & paper client, three leaks on quick couplings and a micro-cracked hose explained a rising weekend baseline; fixing them stabilized pressure immediately at restart.
Network repair and optimization
Depending on criticality, your maintenance teams or our partner teams at SOTEB (also a subsidiary of Groupe Gérard Perrier Industrie) restore tightness, replace fittings and hoses, and adjust pressure by shop. We then propose a periodic leak-hunting program to keep leak rate on target (≤ 15%) and avoid a high baseline returning after shutdowns.
Post-repair verification and improvement loop
After intervention, a dedicated DAT’Power dashboard shows the before/after baseline curve and follow-up indicators: compressor efficiency, run hours, alerts. This short loop confirms gains and feeds your continuous improvement plan, site by site.
Talk to a DATIVE expert to plan a leak-hunting campaign with Les Experts GPI.
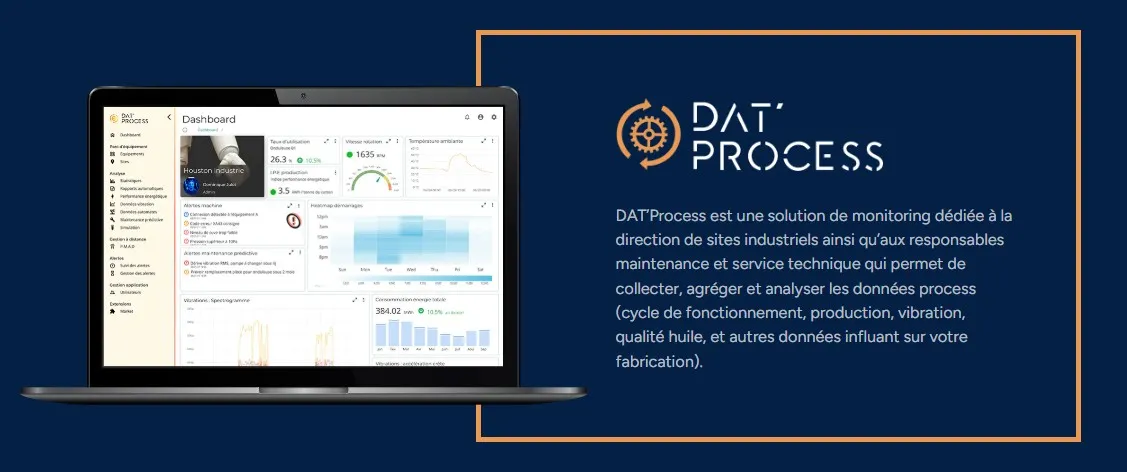
Go further with DAT’Process and predictive maintenance
Correlate compressor states and process signals
With our industrial monitoring solution DAT’Process, you correlate load/idle cycles, vibration, temperature, dryer status, and production information. The benefit is simple: detect early the drifts that herald a failure or overconsumption—slipping belts, leaking check valves, faulty dryer—before they hit your bill or quality. Efficiency (kWh per cubic meter of air) stabilizes again, pressure too, and the team schedules maintenance at the right time.
Example alerts
- Progressive rise in vibration on a bearing → plan a mechanical inspection
- Abnormal increase in discharge temperature
- Idle cycles getting longer → probable leak
- Pressure setpoint too high
Use case: vibration analysis for compressors
A vibration-analysis module placed on compressors at a metal braiding manufacturer tracks operating signatures and flags deviations. Predictive maintenance triggered by a vibration alert on the main compressor—coupled with a slight drop in kWh per cubic meter efficiency—enabled a belt replacement in advance, avoiding unplanned downtime and a weekend baseline drift.
Discover DAT’Process for your compressors and auxiliaries—multi-signal correlation and predictive alerts.
Expected results and success KPIs
- Leak rate converging toward 10–15%
- Quantified avoided losses after maintenance visible in DAT’Power—supporting the solution’s value and maximizing ROI
- Fewer compressor hours → more stable pressure in production and at restarts
- Process incidents avoided → higher line availability
- Full traceability for ISO 50001 and sobriety plans, with automated dashboards and periodic reports—saving your teams considerable time
Book a meeting with our energy experts to estimate your gains, rapidly scope your perimeter, and configure KPIs and reports in DAT’Power.
Conclusion
Hunting compressed-air leaks starts with measuring and prioritizing. DAT’Power highlights the baseline, monetizes losses in €/day, triggers alerts, and helps you decide where to act first. Les Experts GPI secure field execution through instrumented detection, repair, and post-repair verification. With DAT’Process, you move to predictive maintenance—detecting mechanical drifts early and stabilizing kWh per cubic meter efficiency over time.
News

In the industry, it is impossible to optimize what is not measured. In the face of the sustained increase in energy costs, regulatory requirements, and industrial performance objectives, all industrial companies are now concerned with controlling their consumption, whether it is a financial, environmental, or strategic issue.

Looking to control your energy consumption and costs while meeting regulatory requirements (CEE, ISO 50001, BACS Decree)? By combining Carlo Gavazzi sensors and meters, the Dupline fieldbus and the DAT’Power Energy Management System, you can turn your site data into clear dashboards, relevant alerts and actionable decisions, delivering a tangible return on investment.
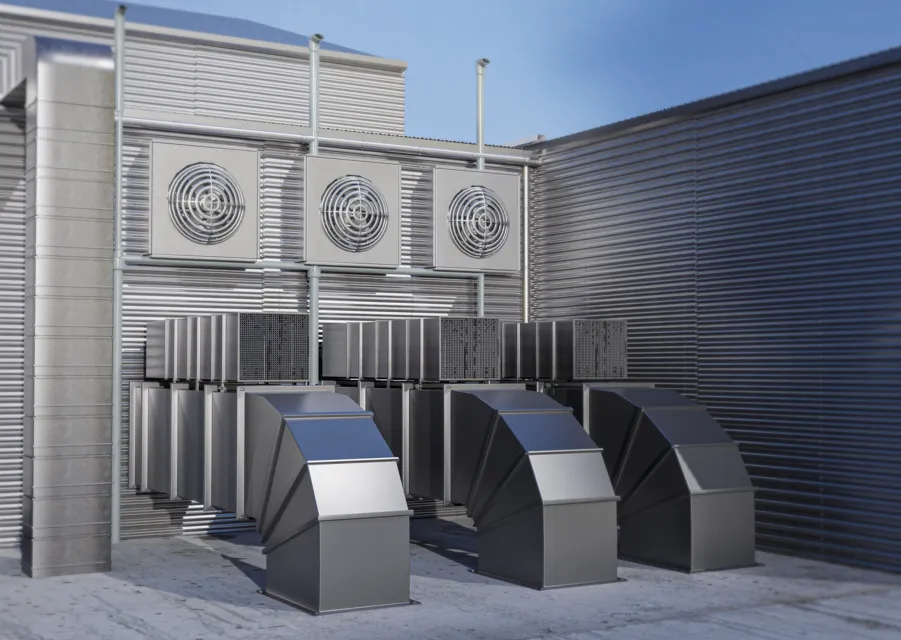
An industrial air-handling system manufacturer selected DAT’Power to structure and optimize its energy management strategy: multi-MES instrumentation, centralized hypervision, and role-specific dashboards. Discover how this project improves responsiveness and strengthens decision-making for energy and maintenance managers.

On December 2nd, our DATIVE teams will participate in the Energy for Industry trade show at the Lyon Convention Center. This event, which has become a must-attend for players in the industrial sector, brings together each year experts, suppliers and decision-makers committed to the energy transition